About:
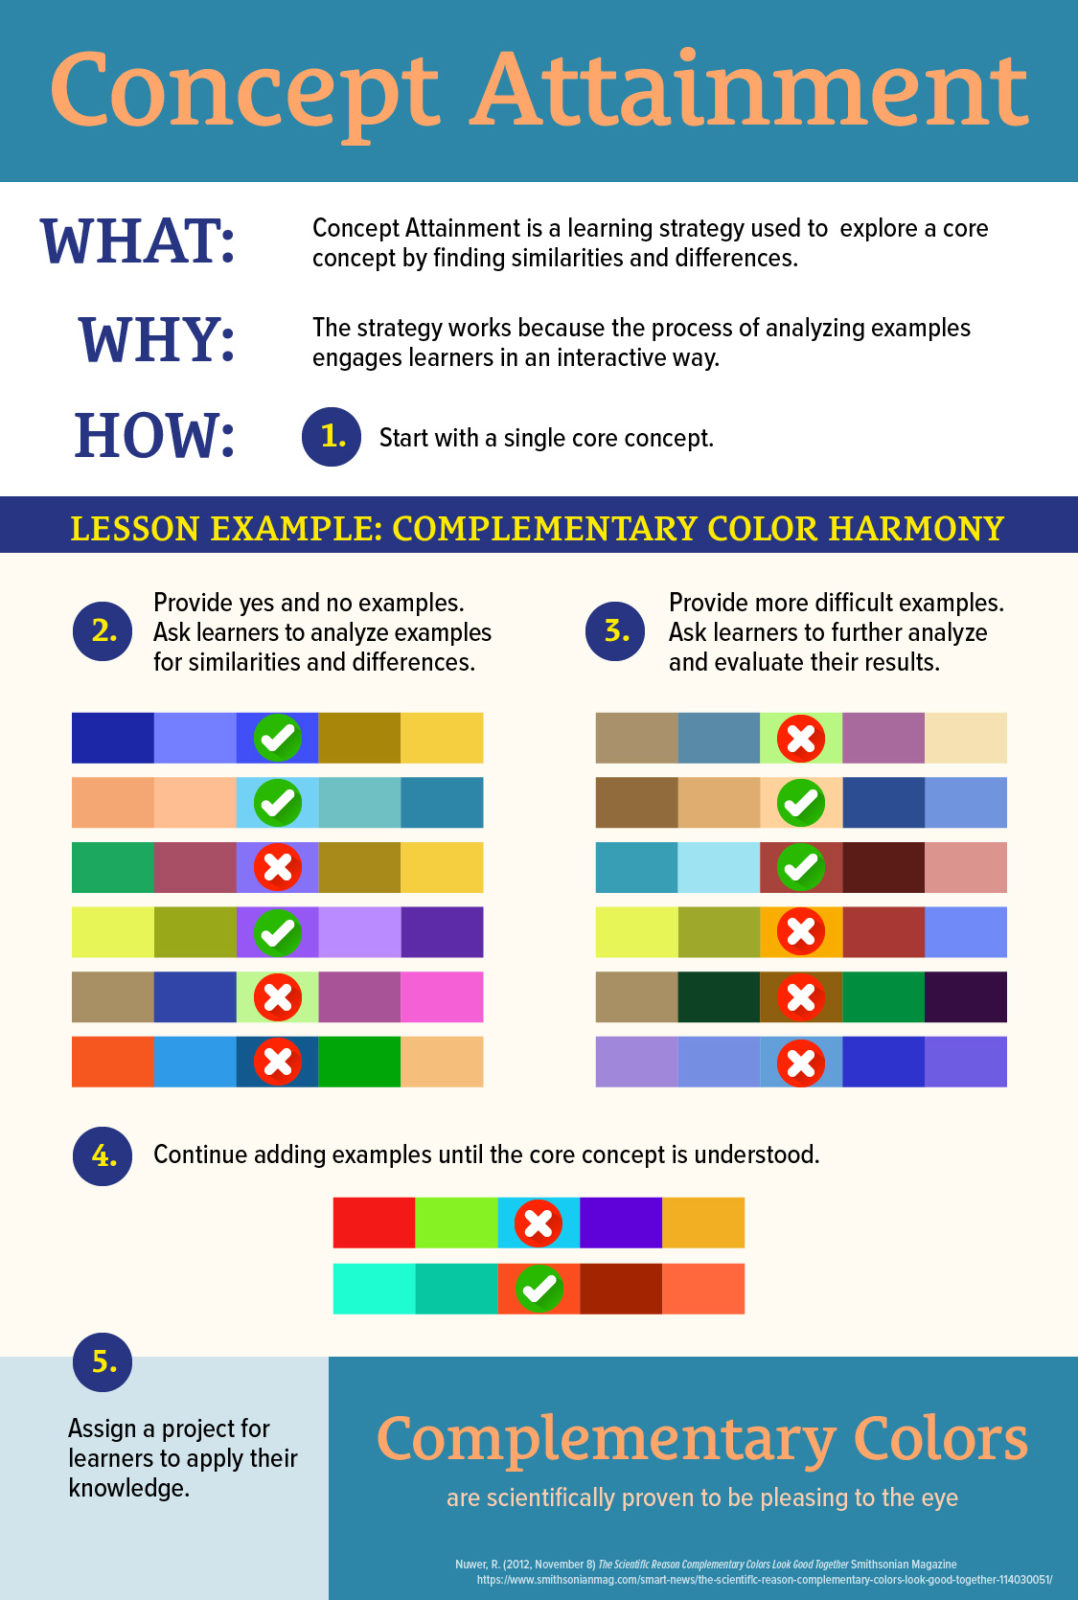
This infographicInfographic is short for information graphic. It is the visual, or graphical representation of data.... More represents the instructional strategy of Concept Attainment as applied to a lesson about complementary colorsColors that fall opposite of each other on a color wheel. More.
Creator Tools:
Adobe Illustrator
License:
![]()


